Once you’ve assembled your team, it’s time to get to work. But many project teams run into difficulties wrestling with issues like how to get started; ensuring they have framed the problem correctly; holding one another accountable; and keeping track of the progress and status of the project. Using the DMAIC problem-solving approach organized and tracked by an A3 report can help relieve all these potential pain points.
The A3 report template takes its name from the size of paper that was mandated for its use by its developers at Toyota. Toyota’s leadership team believed in the power of reducing project planning and resulting status reports to one page. As noted, the A3 format can be used with different methods of problem-solving. For our purposes, we’ll focus on a framework generally referred to by the acronym “DMAIC[1]”. The elements of DMAIC are:
- Define
- Measure
- Analyze
- Improve; and
- Control
While the discipline required to reduce key elements of the process to a single page can be helpful, it’s not necessarily required. (It’s fine, in other words, if your team’s “A3” takes up more than a page— especially in a computer-screen era.) Similarly, there is no single template for A3 problem-solving[2]. Rather, differing types of problems may lend themselves to different problem-solving components and methodologies. For purposes of our discussion, we’ll focus on a fairly generic A3 template, which has a section corresponding to each element of the DMAIC methodology.
While the term “A3” is derived from the form (actually paper-size) used for reporting out on the status of a project, the act of simply filling out the fields in the report is not where the value lies. In fact, setting out on a non-substantive “fill-in-the-blank” exercise to complete an A3 form to satisfy some sort of organizational directive is a complete waste of time. Rather, the value in the methodology is the intense discussion and work that a team should undertake in order to complete each field of the A3 report as thoroughly, but concisely, as possible.
Think of it as a tool to drive focus. Just as narrowing the Universe of Opportunities and bringing focus on a very limited number of problems is helpful in execution, so is agreeing on limiting the scope and focus in your approach to solving a problem. The point, in other words, is not to complete the A3 form, but rather to harvest value out of each of the steps required to get a quality solution to the problem and add value for the organization.
Here’s a description of the main components in a typical DMAIC A3. Again, the component terminology may change, depending on the nature of the organization and problem, but this is a typical approach. Each of these segments is described in more detail later in this section:
Identifying the Problem [Define]: this is where the problem statement is properly framed. Often, this takes the form of describing a gap between the current situation and the desired state. While it sounds simple, it’s important not to skip over, or rush through completion of this critical exercise. Addressing the wrong problem formulation will waste everyone’s time.
Reviewing the Problem [Measure]: This section often contains a brief recitation of the context for the problem; identifies any required data and analysis; and often includes a visual representation of any process involved. This “process map” may represent the “current state” and then be modified accordingly to determine the “future state” required to solve the problem.
Root Cause [Analyze]: The team should use the “5 Whys Approach” to ensure they are not wasting time by addressing a symptom and not the real problem. Tools such as a “Pareto Diagram” can be helpful in illustrating the root causes identified.
Countermeasures [Improve]: These are the steps that the team identifies and agrees must be taken (can be long term and more immediate) to adequately address the root cause(s) of the problem and correct the problem.
Effect Confirmation/Follow-up Actions [Control]: This is where the project shifts into a different phase and the governance process of executing the countermeasures begins. This section is used to document post-implementation conditions to ensure that the agreed countermeasures are having intended effect. This can also be a place to document ideas on how ancillary benefits from the project may be useful to other parts of the organization. Specific accountable individuals and “done dates” should be included in this section. (This might be used in connection with a PDCA loop, as described in the next section.)
Again, it’s important to draw a distinction between completing an A3 form and utilizing the methodology it facilitates. A team should complete most of the form early in the problem-solving process. That does not mean, however, that the problem is solved. More than likely, the team will need to meet more than once (and for more complex problems, perhaps over the course of weeks or months). The form, then, becomes a dynamic living document, whose sections (particularly the countermeasures) are continuously updated.
Often, a problem-solving team will go through the phases of the A3 sequentially and may be asked to report to more senior executive individuals or teams as they approach certain “gates”—or critical points in the problem-solving process. These “gate review” meetings often occur (i) after the problem has been defined and understood and root causes identified, ii) after countermeasures have been proposed but before time and resources have been expended to address them; and (iii) after a solution has been put in place. Generally, the purpose of gate reviews is to ensure that the team has the support of the organization’s key leadership to allocate resources necessary to effectively implement countermeasures. It’s imperative, however, that the senior managers in a gate review not fall into a trap of “second-guessing” or taking over the project. The problem should be solved by those closest to the work. More on that in Part 3 of the course.
Often, problem-solving on projects of this scale contain two distinct phases— especially if the problem is creating an unacceptable experience for customers or some other condition that can’t be tolerated by the organization. In that case, a “containment” or “quick-fix” may be put into place either by an individual or a problem-solving team as quickly as possible. Often, this is not the most efficient solution available and may not be sustainable for a long period of time. However, it’s necessary to “stop the bleeding” in the short term until a more permanent fix can be put into place as the project team advances through the full solution implementation.
A. Stating the Problem [Define]
It kind of makes sense that the first step in the problem-solving process is to actually state the problem. It’s easy to overlook the importance of this step, though, and rushing through it, or doing it in a lazy way, can often waste people’s time and the organization’s resources.
Here are some tips for identifying and expressing a good problem statement as clearly and concisely as possible:
- Define what’s broken. More times than not, an organizational problem relates to something that’s failed in a repeatable sequence of tasks— often referred to as a process. To assist in identifying what’s broken, it’s sometimes helpful to start with “what process does this problem relate to and what do we know about what’s not working related to that process?”
- Clearly identify a gap between the current state and the ideal situation. It’s helpful to be able to refer to actual performance data and to be as specific as possible about the “cost” of the problem. I use the term “cost” here somewhat tentatively, and I don’t mean to imply this will always be a financial metric. It could relate, for example to other elements of pain that the organization (or even more problematic, its customers) is enduring as a result of the problem.
- Avoid the temptation to try to specifically state a cause or solution in the problem statement. The A3 template will lead us through methodologies to do that in later steps and trying to do so by “grasping at straws” may lead to an inaccurate assumption and more wasted time.
There’s no standard formulation of a problem-statement, but many times, the following formulation can be helpful:
“During [x time], the [process in question] with [area of the organization] is not meeting its goal of [y]. This underperformance is costing the organization [z].

Let’s try an example to make all of this a bit more real. While I’m drafting this section, my wife just entered the room and informed me that on my trip to the grocery store yesterday, I failed to get the coffee creamer that she prefers. Unfortunately, this is not the first time I’ve failed on this and similar requests. Maybe it’s just because I’ve got problem statements on the mind, but it seems to me that I can use the guidance dispensed above to craft an effective problem statement that will help give me a head start on eliminating this problem going forward.
Let’s start with some accurate, but not entirely helpful articulations:
- My wife is mad at me.
This is (currently) a true statement and definitely constitutes a problem with an improvement opportunity but doesn’t really get us far enough down the road to be particularly actionable.
How about:
- I keep failing to buy the right coffee creamer.
Closer. This is more actionable, but it would be helpful from a problem-solving standpoint to have a bit more contextual insight. It may sound a bit silly in this example, but a good problem statement sets up enough context so that a diverse team of problem-solvers with differing backgrounds and familiarity with the situation can have enough contextual information to begin digging in. For example, does this happen often? Is it something that just started or is there a history? Is there a discreet set of repeatable activities (ie a process) involved?
How about this:
- In 3 of Clay’s last 6 weekly trips to the grocery store, he has failed to purchase sugar-free french vanilla coffee creamer for Amy. Without sugar-free french vanilla coffee creamer in her morning coffee, Amy isn’t as happy or productive as she’d like to be.
You get the idea.
B. Reviewing the Problem [Measure]
After you’ve put the work into properly defining and stating the problem, the next step is often to gather and assess data to better understand what’s going wrong. If you’re dealing with a defined process that has a metric tied to it, a good place to start is always to look at the performance data over a series of time to drive more context.
In my grocery store example, it’s not like there’s a defined scoreboard metric. But a team looking into this problem may look for additional data insights, such as:
- How often does this occur?
- Does Clay get the wrong creamer or does he forget to get creamer altogether?
- What is Clay’s process for preparing to go to the grocery store?
- How does he choose the store?
1. Process Mapping
One way to gain better understand of the problem and the process to which it relates is to generate some type of visual depiction. This is often referred to as “process-mapping”, but don’t let that terminology turn you off. At its essence, process mapping is just a visual tool used to better understand, and begin to improve, a repeatable set of tasks or activities that occurs around a problem. In other words, process maps make the invisible visible and provide a mechanism for ensuring that everyone on the team is discussing the same thing. Once a process map is created, team members will often develop a better understanding of what’s leading to the problem and have a useful communication tool.
As with many of these tools, there’s no right or wrong way to build a process map. Here are some tips I find helpful:
- Make sure that you have at least one (the more, the better) member of your team who has participated in the process in question. We’ll talk more about “Going to the Work” in Part 3 of the course, but it’s always a good idea to have one or more members of a problem-solving team actually observing the process from what they believe to be from start to end—maybe even taking notes— before beginning the process mapping itself.
- Begin by identifying the process boundaries. These are just the initial task in the sequence and the final step. In the coffee creamer problem statement above, the process at question is my weekly trip to the grocery store. The boundaries may be:

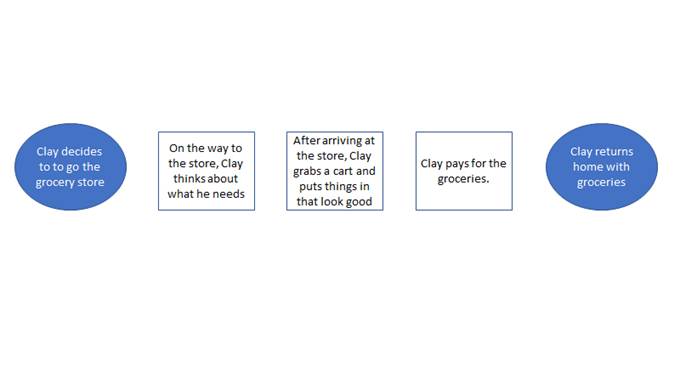
- Next, we identify the steps between the boundaries. Ideally, this would be anywhere from 3-10 steps (more than that and you should consider breaking down the activity into sub-processes, each with 3-10 steps.). At this stage, keep the focus on the “as-is” state. Below is a simple depiction of my as-is grocery shopping process:
- At this stage, a good problem-solver starts asking what additional elements need to be filled in to tell a more complete story and gain better understanding.
- Are there key steps missing?
- What are the inputs and outputs to each of these tasks?
Asking and answering these questions can build better insights into not just the as-is process, but the things that either are, or could, stand in the way of achieving the desired result. At this stage in documenting the map of my grocery store process, for example, a facilitator may ask, “what does Clay rely on to put together his list of things for the grocery store? How does he get there? What does he need to pay for the groceries” etc. After this discussion, the process map may look something like this.
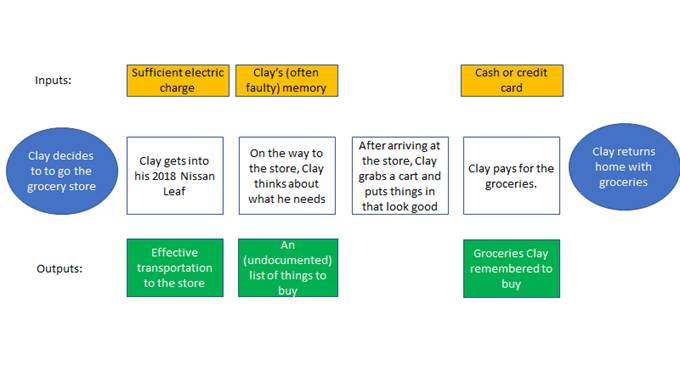
- The illustrative process above is a pretty simple — one-person process. In more complex situations, you may also add a row, or introduce color-coding, in the process map that clarifies what person or stakeholder department is primarily accountable for accomplishing each step. (In this simple example, it’s all Clay.[3])
- At this stage in focusing on the “as-is” process, some improvement opportunities should be emerging. At this point, the team can begin looking for
- duplication/redundancy,
- steps that aren’t adding value (a key question to identify non-value-added steps is “is this something that our customer/stakeholder would be willing to pay for?)
- steps that should be added or enhanced.
- who depends on various steps for what output and is that output being delivered in a timely manner.
For those of you feeling anxious about leaving such a lousy “as-is” process, between reading this and coming to class, start playing with what additional steps could be added to improve this process and helping to solve the problem. We can then come back to my grocery shopping in class and explore some ways in which the process can be improved.
Here are some other tips that I’ve found effective for process-mapping sessions:
- While not available in a remote-work setting, I find analog approaches to process-mapping are generally more effective and engaging for a team. Handout markers and begin working on a whiteboard or hang butcher’s block paper. Post-it notes can also be used to help facilitation of re-ordering steps. After you’ve discussed and completed the exercise, then you can convert to digital, using powerpoint, excel or dedicated software, such as visio.
- The example above uses circles for process endpoints and boxes for interim steps. This is fairly standard, but not required. You’ll also often see decision points reflected as diamond shapes.
- As you draft, (especially in analogue on paper) it’s a good idea to insert placeholder boxes for steps, inputs and outputs that will likely be populated as the discussion progresses.
2. Data and Context Gathering
The grocery store example we’re examining in this section is like a lot of “real world” problems in that it arises out of a situation where people don’t normally think of things like “process” and “metrics”. However, in a more traditional (and better run!) organization, these concepts may give problem-solving teams a bit of a better head start on the “Review [Measure]” stage.
For example, Jaime, our friend from Acme Financial, may form a team to solve a problem stated as
“Between January and June, past due rates in the Southern Mexico region have averaged 7.5% versus a year-end target of 4%. This overage has led directly to a default rate of 6%, which has caused the region to lose over $800,000 in accountable profit.”
As the team proceeds to Review/Measure, they may gather additional data such as:
- How has the region performed historically on past dues?
- How are adjoining regions performing?
- What changes exist between those time periods/regions?
- Has the collections process been mapped?
Gathering and discussing this data may lead to some insights that can identify other key processes that may need to be mapped or refreshed and perhaps position the group well for further analysis and root cause development.
Reflection Questions
1. Can you think of an example where a team or individual expended significant amount of time attempting to solve the “wrong” problem? Could be historical, contemporary, personal, professional, or fictional character(s).
2. What do you think caused them to misframe the problem?
3. Play around with “process-mapping” a set of repeatable steps that you (along possibly with other teammates) engage in on a regular basis. Are there areas in this process that sometimes go wrong or cause problems? Why?
C. Identifying the Root Cause [Analyze]
In the “Analyze” phase of the project, the problem-solving team often takes the data identified and collected in the “Measure” phase (including process maps) and begins to study it in order to look for improvement opportunities.
Sometimes, the data gathered in the “Measure” phase will include some level of benchmarking from either past experience, or other organizations, in an attempt to define or target a “future state”. In other words, to determine when a problem is solved, it’s helpful to set a target based on data available. In the “Analyze” phase, teams will often define, from the data available, specifically what that “done” or “future state” looks like, in terms of metric performance (targets). They will also define the “as-is” or “current state” in terms of the data available. Then, the team can begin process of assessing the gap between the two states, which can be helpful in generating countermeasures in the next phase.
Imagine, for example, a soccer team that has defined a problem statement identifying the need to score more goals. In the measurement phase of the project they gather data, not only about their own performance, but about that of the top-performing teams in their league. Doing so, they may learn that other teams have almost twice as many shots on goal from within the box [4]than they do. This may lead to a discussion of their “current state” shot totals versus a “future state” in which they achieve as many shots from within a certain range as the highest performing teams.
Often, the “Analyze” phase will also include some level of root cause analysis. We talked in Part 1 about the importance of identifying the root cause of a problem in the context of filtering and evaluating the Universe of Opportunities. (Remember Coach Kelly’s team’s free-throw shooting?) Ensuring you identify root cause(s) is also an important component of most problem-solving methodologies. Countermeasures (our next section) designed to address symptoms and not root causes will ultimately lead to wasted time and re-work.
We’ve already talked about 5 Why Analysis, so I’ll spend most of this section describing two tools that may also be helpful in identifying root cause. The first is the Pareto Chart. Recognize that name? Pareto charts are often used to graphically illustrate the “Pareto Principle” (aka the 80/20 rule) we discussed extensively in Part 1 of the course. It does so by displaying major causes of a problem or condition along the horizontal or “X” axis and measuring their impact (often in terms such as time or money) along the vertical or “Y” axis. The tool is particularly helpful when you are trying to determine the relative impact of multiple potential causes on a problem, and you have sufficient data available.
1. Pareto Chart
Let’s imagine that Ian Happ, left fielder for the Chicago Cubs, has defined a problem that he feels like he’s swinging and missing too much over the last week.[5] Understanding the types of pitches that he’s missing may help him identify the root cause and develop effective countermeasures. So, he goes to the Cubs analytics team and asks them for a Pareto diagram breaking down his last 100 “swing and miss” events. They may respond with something like this:
The pareto chart above shows that the two pitches that appear to be giving Happ the most problems recently are the cutter and the 2-seam fastball. (It appears from the chart above as if he’s missed about 25 cutters and 15 2-seamers.) The slider is the next highest whiffed-on pitch at just 5. So, of the fifty or so pitches that Happ has swung on and missed in the last week, forty of them, or 80%, are either cutters or 2-seam fastballs. (You can see the cumulative percentage via the gray line that corresponds to the x axis on the right.) This analysis suggests that finding a way to make better contact on those two pitches should decrease Happ’s strikeout rate considerably.
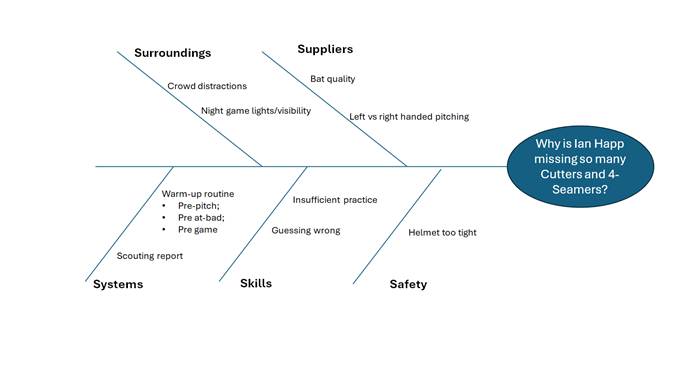
2. Fishbone Diagram
Another common tool often used to understand and classify root cause is called a “Fishbone Diagram”.[6] A Fishbone Diagram is often developed in problem-solving team meetings and can be helpful in both better understanding a problem and getting to its root cause. It’s especially helfpful when “harder data” (such as Happ’s swing and miss pitch data) is not available.
It does so by starting with a group of useful categories. It takes its name from the shape of the diagram. Generally, there’s a problem statement at the head and differing categories of problems and their potential causes act as “ribs” floating off the diagram spine.
It’s a common tool in manufacturing quality problem-solving, and the primary categorization of cause types is sometimes referred to as the 6M’s: Materials, Methods, Measurement, Mother Nature, Machinery and Manpower. However, different causal categories can be used for different industries and problem types. Service industries, for example, who want to categorize causal types often use 5 “S”’s: Surroundings, Suppliers, Systems, Skill and Safety.
A problem-solving team would use these categories to brainstorm causes of the problem statement by listing 2-3 causes for each category on Fishbone diagram. This can help the team better understand the problem and put it into a better position to begin addressing countermeasures.
Having identified that if he can make better contact on two pitches (see the above pareto analysis), let’s imagine that Ian Happ creates a problem-solving team consisting of his hitting coach, and two teammates to brainstorm potential causes. They might construct the following Fishbone Diagram.
D. Developing Countermeasures [Implement]
Once root causes are identified, it’s time to develop steps that people within the organization can take to address those root causes. Note the italics in that sentence. It’s not critical that the steps be executed specifically and exclusively by the members of the team. However, if the step(s) cannot be accomplished by a member of the team[7], then the members of the team should be in a position to be able to influence others within the organization to accomplish the step(s). These steps, which may be quick and simple or longer, complex projects, are sometimes referred to as “countermeasures”.
A common and effective way to begin developing countermeasures is to simply draw the team together and brainstorm. This may be just the members of your core problem-solving team, or you could “open the tent” at this stage and invite other subject-matter experts to participate in a countermeasure brainstorming exercise.
The key to a good brainstorming meeting, in my experience, is to start broadly and encourage open discussion in which the differing backgrounds and experiences of your diverse problem-solving team are leveraged. It’s usually not necessary for this session to be heavily structured. However, here are some high-level best practices for the initial “idea generation” phase of the countermeasure process:
- Designate one team member as the moderator. Moderator duties may include:
- Ensure ideas are documented either by them or by another designee.
- Play the “traffic cop” role to clarify who “has the floor” at any given moment and try not to allow too much over-speaking by more enthusiastic team members;
- Develop, circulate and administer the agenda;
- Have at least a loose agenda. We talk in more detail about “meeting hygiene” in Part 3 of the course, but a countermeasure meeting might have at least 3 agenda items:
- Overview of the Problem Statement, Problem Review and Root Cause sections of the A3. This is simply to get the juices flowing and get everyone mentally (re-)acquainted with the problem, context and history;
- For each root cause identified, open-discussion on potential steps that the organization might take to address them;
- Review documentation of all ideas generated and re-word as necessary to sharpen and clarify.
It can be helpful to attack the countermeasures through two separate meetings. One, described above, to identify the “Big Ideas” followed by a separate, follow-up session to begin evaluating those ideas more critically.
By nature of the process, not all ideas that are captured in a brainstorming session are generally worthy of becoming adopted as countermeasures.[8] After you’ve tapped the team’s creative juices and recorded a lot of ideas, it’s time to begin to narrow those ideas down to ensure you are focusing on things that (a) will effectively address a root cause of the problem; and (2) can actually be executed by the organization.
One relatively simple tool for doing this is called an “ease vs impact” matrix. There are various levels of objective quantification that can be brought to this methodology, but the easiest is simply to individually poll your team members (or other organizational experts), and, for each identified countermeasure candidate, ask the team of experts to rank from a scale of 1-9 how effective this proposed measure would be in resolving the previously identified root cause of the problem. Then, with respect to the same countermeasure candidate, ask the same group of people to rate on the same scale how difficult the countermeasure would be for the organization to actually accomplish. Average the scores and then plot them on a graph. In finalizing your countermeasure plan, you’ll want to prioritize countermeasures that are most impactful and easiest. Then, have an appropriate conversation around budget and timeline to sequence the most impactful and complex ideas.

A Pugh Matrix (sometimes also referred to as a decision matrix) is another quantitative tool that can be used to evaluate options. To use this framework, the team identifies 3-6 important criteria to measure different countermeasure options and assigns a weight (typically 1-10) to each criteria. Then the list of countermeasure options is each separately evaluated against the criteria, and a quantitative score is developed that can be useful in comparing potential options against one another.[9]
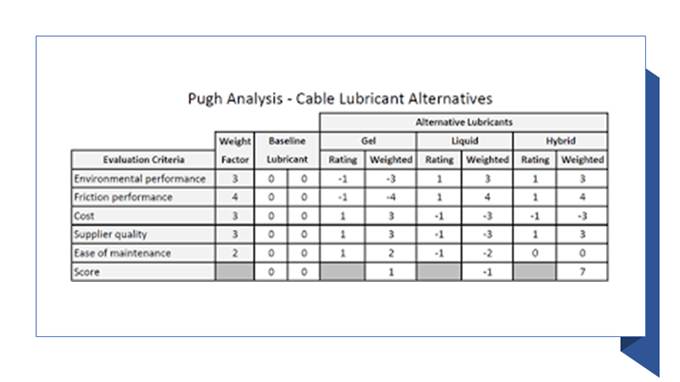
Through the use of tools like “Ease vs Impact” and Pugh/Decision matrices, teams can identify the most impactful countermeasures on which to focus. Well-constructed countermeasures, like SMART goals discussed in Part 1 should be Specific, Measurable, Achievable, Relevant and Timebound. Sometimes, teams find it helpful to capture higher-level “fuzzier” concepts immediately and then followup to make them more actionable as more data is available. Before launching the execution phase, though, there should be absolute clarity about who will be doing what by when.
It’s sometimes best to think in terms of two categories of countermeasures. One category is lists of longer term steps that may require more data or work to break down into more specific tasks. (These probably wound up in the impactful/difficult quadrant of the ease vs impact matrix.) You may, in fact, need to launch a separate project staffed by a separate team of problem-solvers to address some of these. The other category are simpler tasks that can be accomplished on a shorter timeline.
Another possibility is to capture the larger, less specific countermeasures as category headings and then break them down into smaller, more action-oriented tasks beneath each larger category.
The point is to make sure the team doesn’t get lost, or overwhelmed, in amorphous and complex concepts that just sound too hard to take on. When faced with those types of “soft” or “conceptual” ideas that don’t appear immediately actionable, always push for ways to break them down into more actionable incremental steps that people can commit to completing.
Before finalizing and documenting countermeasures, consider validating them through the following checklist or something similar:
- Does the majority of the team feel this countermeasure, when completed, will help address the root cause of the problem?
- Is this countermeasure expressed in a way that we will be able to tell when it is finished?
- Is each countermeasure connected to a name of the person accountable for its completion?
- Is there a due date for each countermeasure?
E. Executing the Countermeasures [Control]
After identifying the root causes and developing countermeasures, the typical problem-solving project enters into a different phase that sometimes requires a differently configured team. Ideally, the people generating the countermeasures will have sufficient knowledge of the organization and its systems, as well as authority to execute the countermeasures. This isn’t always the case, though, especially in larger organizations, so it’s a good time to pause and assess whether you need to add members to your team or reconfigure it before moving forward into execution.
A successful implementation team should have members empowered and capable of both:
1) effectively influencing others, through either formal or informal authority; and
2) accessing key resources necessary to accomplish the countermeasures.
Once you’ve confirmed the right membership on the team and shared with any new members the knowledge necessary to bring them up to speed on the project, it’s time to deploy a “Plan-Do-Check-Act Loop”. (Sometimes referred to as a PDCA Loop or PDCA Cycle.)

The loop or cycle begins with the Plan. For the initial cycle, the identification of original countermeasures and assignment of deadlines and responsibility constitutes this phase and the kickoff of the cycle.
The “Do” phase consists of accomplishing or making progress on countermeasures during a specific phase of time. This may involve the changes necessary to adjust or re-engineer an organizational process (like coffee creamer shopping).
In the “Check” function, the team compares actual results against the plan. Were the steps agreed upon in the plan accomplished? If not, why not, and what can we learn? Have we identified key measures associated with any of the processes that we’re addressing? How are they performing? Are we encountering a new problem that we didn’t anticipate in the original plan?[10]
In the “Act” (or sometimes called “Adjust”) phase, the team will take the information gleaned through the “Check” function and determine what updated or corrective actions are necessary. Those actions then get documented as countermeasures and bring us back to the Plan.
Distinguishing 4 separate functions in the loop can mislead some into thinking that it takes 4 distinct meetings to administer a PDCA cycle. That’s generally not the case. In fact, it’s far more common for all 4 phases to be addressed in the same meeting.
How often (and for how long) the team meets to administer the cycle depends on the nature and complexity of the problem and its importance and urgency relative to other problems making demands on the organization. The most important thing is to meet regularly and to make sure there’s a designated resource documenting updates to the plan on the A3 form or elsewhere.
Here are some summary best practice tips for Execution/PDCA Teams:
- Be sure there’s a designated person in all meetings recording action items, due dates and owners on the A3 document or another agreed upon “safe source.”
- The team should meet regularly and schedule meetings well in advance. The practice of “calling a meeting when we need it” rarely works for this type of function and things will quickly fall apart.
- Keep meetings as short as possible. Adhering to an A3 template format will help this.
- Make sure you are involving people on the team who are actually doing the work related to the problem. Their perspective is key.
Ensure that everyone leaves the meeting with absolute clarity on next steps and specifically who will do what.
[1]. You will also see a similar approach referred to as DMADV, another acronym standing for Define; Measure; Analyze; Design; and Validate. These are essentially different labels for the same approach.
[2]. Google A3 Problem-solving template and you’ll find many different images and formats.
[3]. Which is generally a problem in itself!
[4] For non-soccer (football) fans, “the box” is a term often used to describe an area on the pitch 18 yards deep and 44 yards wide which surrounds the goal. Because of its rather close proximity to the goal, it is highly sought-after real estate during a match.
[5]. Non-baseball fans will be frustrated by the non-inclusive nature of this example, and may find the following background helpful. A baseball batter, like Happ, is allowed 3 “strikes” per plate appearance before committing an out for his team. One way to accumulate a strike is to swing at a pitch and miss. Pitchers, in an attempt to accumulate strikes, may attempt a number of different types of pitches. Common pitches in major league baseball include 2 different types of fastballs (cutters and 4-seam); sliders, curveballs and changeups.
[6]. Sometimes also referred to as “cause-and-effect diagrams, or Ishikawa diagrams. Please see the additional assigned reading for more detail around the construction and utility of this helpful tool.
[7]. Whether for lack of expertise, time or other constraint.
[8]. This is intentional. All ideas in a brainstorming session should be accepted and not judged. The judging happens later.
[9]. Please see the separately assigned video and reading for a fuller explanation of the Decision Matrix and how it can be constructed and used.
[10]. This will always happen as new information becomes available and is not a bad thing. If new information is not being surfaced and changes to the plan are not being made, that’s when you need to start worrying about the effectiveness of the team.

Leave a comment